Data Updates

2016 Annual Report
Data Updates
2016: A continuing transition
2016 data updates show that gasfields towns appear to still be in transition, rather than reaching a 'new normal' state.
Resident populations continue to increase in most towns, although growth rates have slowed right back to around 1% per year or below.
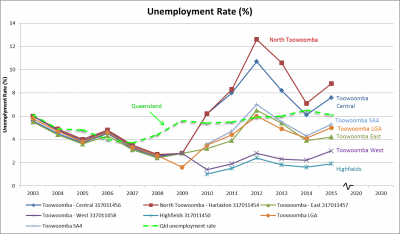
Unemployment is generally rising. The number of people receiving commonwealth government payments or assistance in some towns also increasing.
Business incomes increased sgnificantly in 2012-13 and although declining since then in most towns (in Chinchilla business incomes continue to increase) remain around 4-5 times pre-CSG averages.
2015: Follow historic trends or a new 'normal'?
Toward historical trends? - As of the end of 2015, some of the key indicators that we are tracking - such as the sale prices of houses in some towns - were showing a return to historical trend after the economic upswing from the CSG construction phase. Non-resident workers are leaving in significant numbers. Unemployment trends reflect a number of factors, such as some who are losing CSG sector and related jobs are leaving town, others may be staying and looking for work, and some families on government payments are moving to town to take advantage of lower rents. Generally, unemployment rates in these towns are rising while the Queensland rate has declined. Crime rates are reflecting local conditions as well as a state-wide upsurge in drug-related crime. A conclusion - still fluctuations, but one may be seeing a 'new normal' developing. Charts of these trends can be seen on this website here.
Rental housing - The indicator trends for weekly rent on a 3-bedroom house are different from some other indicator trends. During the early part of 2016, they are dipping below where an historical trend suggests they would be. Our interviews in 2015 underlined a local concern about empty houses. The question now is - to what extent is this figure an 'overshoot'? Will rents could return to 'normal' in a year or two? That is what they did after construction of the Kogan Creek power station outside the town of Chinchilla. Who will move into the new houses and what will they add to the community and local economy? According to our interviews, school enrolments are rising but also needs for more social services for low-income families.
Drugs - The figures for 2015 indicate a rising rate of drug-related crime. The numbers are trending upward just as they are across Queensland and Australia. Our interviews found that some of this upswing in the CSG area might be attributed to greater availability of drugs occurring with the influx into the region of contractors. That is, new 'customers' bring drug dealers, the police stated. Will the rise abate now that fewer contractors are in the region, as suggested by declining figures on non-resident workers?
Incomes - How about personal incomes in 2015? Average incomes - government statistics show - seem to be staying higher than before, even though the CSG construction boom has ended. Business incomes, which had been steady for a decade, shot up 4-fold or more in several towns during the height of CSG construction. Data for 2014 (the latest data from the ATO) shows the start of a decline. Where will business incomes level out - higher than pre-CSG times?
Mining industry - Our research revealed changes that accompanied CSG development on the towns profiled. However, Wandoan seems to have been strongly affected by beginnings of a major mining project that then was put on hold. Moranbah and Dysart in the Isaac local government area also appear to be following a different trajectory. For them, the local economy is dominated by coal mining, with CSG development having a relatively insignificant effect. As a result, these two towns evince effects that are more typical of major ups and downs that accompany mining - e.g., Queensland's resources boom and recent decline. For 2015, they are experiencing the effects of a significant drop in coal prices and cutbacks at the local mining companies.
Town data booklets - Town data booklets for the nine target communities profiled are downloadable from the pages reached by links below. The town data booklets contain charts covering population, income, employment, housing costs, and crime rates. They also address rainfall (critically important in an agricultural area) and petrol prices (a cost of living indicator). A meaningful figure for CSG industry activity is still being sought – level of energy use by town, number of mobile phone calls, sewerage flows. One such indicator might be the number of non-resident workers in the local government area. So, we have added that figure to the charts on this website. Figures from the Queensland Government Statistician's Office (QGSO) for non-resident workers near each town are provided in the town data booklets.
Interviews - The town data booklets contain insights from interviews of up to ten key stakeholders in each community. We interviewed mayors, school principals, real estate agents, police commanders, community centre managers, hotel owners, heads of chambers of commerce, and others in similar prominent roles. These individuals were identified by our research and by recommendations as broadly knowledgeable about specific aspects of each town. The interviews provided information to help explain what has happened historically: cause and effect as seen locally. The interview insights referred to in the booklets also present expectations, concerns, and recommendations from these key community members. We are not endorsing or critiquing these recommendations, merely passing them on. More discussion of the interviews is provided below.
2015 Data Reports - Summaries, Charts, Booklets
Western Downs
Dalby – Chinchilla – Miles – Wandoan
Maranoa
Toowoomba
Isaac
New Indicator – Business Income
For our update on 2015, a new indicator of business income has been tracked in the target towns. We comment below on farm income, as the region is largely agricultural. However, we have not tracked that figure for all towns as our focus has been on in-town businesses.
Farm income - This indicator shows a sharp increase in business income in 2012 in Chinchilla, for example. It rose from an historical average of $5 million / year to nearly $20 million / year. That is for non-farming businesses (non-primary industry). For comparison, the total of farm business incomes (primary industry) for the district tend to hover around a half-million dollars per year. Traditional wisdom suggests that farm incomes tend to be kept low by landholders in order to minimise tax obligations. That is a strategy taken by other small business owners, as well. Money received via a farmer's conduct and compensation agreements (CCAs) with the CSG companies does not count as part of this figure. That figure, which has been quoted as averaging from $2,500 per well per year to $10,000 per well per year, is officially 'compensation', not income.
Non-farm income - The figures for net (after taxes), non-farm, business income are on the order of one-tenth of the total for individual income for the district. Gross (not net) business incomes in Chinchilla spiked in the financial year 2011-2012 with the onset of extensive CSG construction and flood reconstruction. A big upward step in net incomes occurred in the financial year after the flooding losses, in 2012-2013. The extent of distribution of this income across businesses for any given town has not yet been determined. For the 2013-2014 income tax year, business incomes started to decline. Figures for 2014-2015 have not yet been published by the Australian Tax Office.
Economic outcomes - We aim to draft a feature article for this website on economic outcomes across the local government areas studied. That will take into account our indicator data on personal income and business income as well as insights from a recently completed study (June 2016) of small to medium sized enterprises by a team from the UQ Graduate School of Business. There may also be insights available from a PhD study on women-led business in two communities in the Western Downs.
Interview insights
Ground truthing - Data has been ‘ground truthed’ via interviews with key stakeholders in each town. These interviews have been invaluable. We appreciate the time invested to answer our questions despite the 'consultation fatigue' often cited for the region and stresses accompanying the downturn as the CSG construction phase ended, the onset of a transition to 'the new normal'. We have found community and government leaders, key local residents, and business owners ready to talk for anywhere from 30 minutes to 2 hours.
Responding to charts - Each one was presented with charts of the trends since 2001 in key indicators that are relevant to their area of responsibility or interest. For example, a real estate agent was presented with charts on trends in the sale prices of houses and on weekly rent for a 3-bedroom house. These charts provided a focus for each interview.
Concerns & successes? - As one might expect, a range of concerns accompanying the changes in each town are revealed. Stories of success tend to be less pronounced. Some would suggest that it is 'un-Australian' to talk about one's financial success. It is also not necessarily good business practice to reveal to competitors and customers how much money one has been making. The level of business activity does get discussed, though. That is in terms such as 'our turnover doubled', relative figures. Also, being clever is celebrated and discussed. For example, a landholder will talk about how they have arranged to sell water or gravel to the CSG industry, in addition to receiving payments via their conduct and compensation agreement (CCA).
How changes occur - These interviews are revealing how certain changes are occurring, changes evident in our indicator data. For example, there has been a flow in 2015 of families on low or fixed incomes to vacant houses in key centres, such as Roma and Chinchilla. That is because rents have been dropping down to or below the historical trend line. Some of these houses are reported to be relatively new. They reflect building that occurred too late to be of use during the CSG construction phase. Local residents whom we interviewed report that quite a few of the houses were not built well. We say more about housing in the 'feature article' in the section - 'Opportunities and Challenges'.
Relevant Reports
The Regional Australia Institute has data at the regional level for regions around Australia, generally. This information is accessible in interactive graphical format. They also have a database of thousands of other regional development publications. Both are available here.
Last updated 25 June 2019
Last reviewed 19 May 2016